4.2 KiB
4.2 KiB
Scraping Load Testing - Test #3
Summary
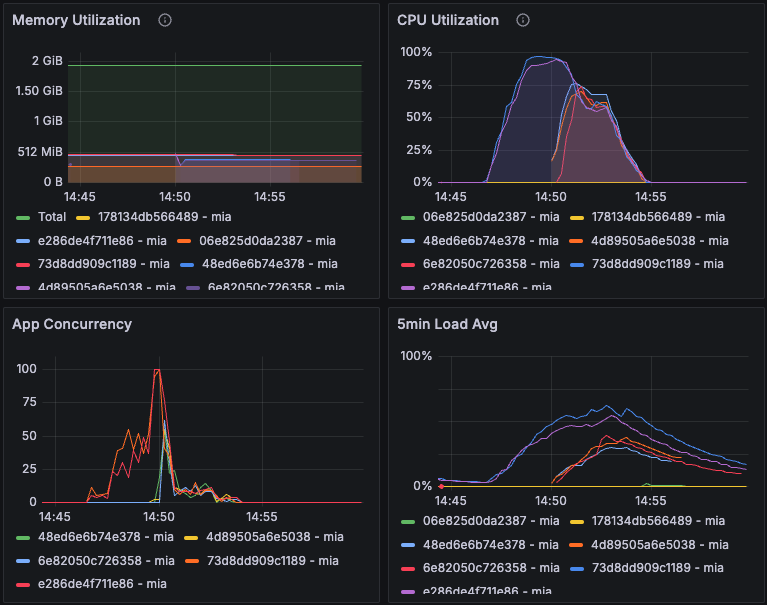
The load test involved setting up an autoscaling option and adjusting the hard and soft limits for the Fly.io configuration. The test environment consisted of 5 machines, with 3 machines automatically scaling up during the test. Despite the scaling, there were 653 timeouts (7.3%) and 2 HTTP 502 responses (0.02%). The average response time was 3037.2 ms, with a peak response time of 9941 ms. Further adjustments to the soft limit are recommended to improve performance and reduce errors.
Table of Contents
Test environment
Machines
| Machine | Size/CPU | Status |
|---|---|---|
| e286de4f711e86 mia (app) | performance-cpu-1x@2048MB | always on |
| 73d8dd909c1189 mia (app) | performance-cpu-1x@2048MB | always on |
| 6e82050c726358 mia (app) | performance-cpu-1x@2048MB | paused |
| 4d89505a6e5038 mia (app) | performance-cpu-1x@2048MB | paused |
| 48ed6e6b74e378 mia (app) | performance-cpu-1x@2048MB | paused |
Load Test Phases
Configuration
# fly.staging.toml
[http_service.concurrency]
  type = "requests"
  hard_limit = 100
  soft_limit = 75
# load-test.yml
- duration: 60
arrivalRate: 10  # Initial load
- duration: 120
arrivalRate: 20  # Increased load
- duration: 180
arrivalRate: 30  # Peak load
- duration: 60
arrivalRate: 10  # Cool down
Results
Date: 14:53:32(-0300)
| Metric | Value |
|---|---|
| errors.ETIMEDOUT | 653 |
| errors.Failed capture or match | 2 |
| http.codes.200 | 8345 |
| http.codes.502 | 2 |
| http.downloaded_bytes | 0 |
| http.request_rate | 11/sec |
| http.requests | 9000 |
| http.response_time.min | 979 |
| http.response_time.max | 9941 |
| http.response_time.mean | 3037.2 |
| http.response_time.median | 2059.5 |
| http.response_time.p95 | 7709.8 |
| http.response_time.p99 | 9416.8 |
| http.responses | 8347 |
| vusers.completed | 8345 |
| vusers.created | 9000 |
| vusers.created_by_name.Scrape a URL | 9000 |
| vusers.failed | 655 |
| vusers.session_length.min | 1044.5 |
| vusers.session_length.max | 9998.8 |
| vusers.session_length.mean | 3109.7 |
| vusers.session_length.median | 2143.5 |
| vusers.session_length.p95 | 7709.8 |
| vusers.session_length.p99 | 9416.8 |
Metrics
Conclusions and Next Steps
Conclusions
- Performance: The system handled 9000 requests with a mean response time of 3037.2 ms. There were 653 timeouts and 2 HTTP 502 responses.
- Autoscaling: Three machines automatically scaled up during the test, but the scaling was not sufficient to prevent all errors.
- Response Times: The peak response time was 9941 ms, indicating that the system struggled under peak load conditions.
Next Steps
- Adjust Soft Limit: Change the soft limit to 100 and the hard limit to 50 to test if machines will start faster and reduce the number of 502 errors.
- Further Load Tests: Conduct additional load tests with the new configuration to assess improvements.
By following these steps, we can enhance the system's performance and reliability under varying load conditions.
